Market Consumption

This year's report reflects on the consumption over the previous two years to compare the pre-pandemic consumption with the impact of lockdown restrictions on trade for non-household customers.
The impact on the non-household customers has been varied. We observed sectors such as hospitality, leisure, retail and education were particularly affected, with retailers applying temporary vacancy flags or reducing YVEs to manage estimated consumption. Marston's PLC, one of the UK's leading independent brewing and pub retailing business and self supply retailer, details the impact of the pandemic from both a customer and retailer perspective.
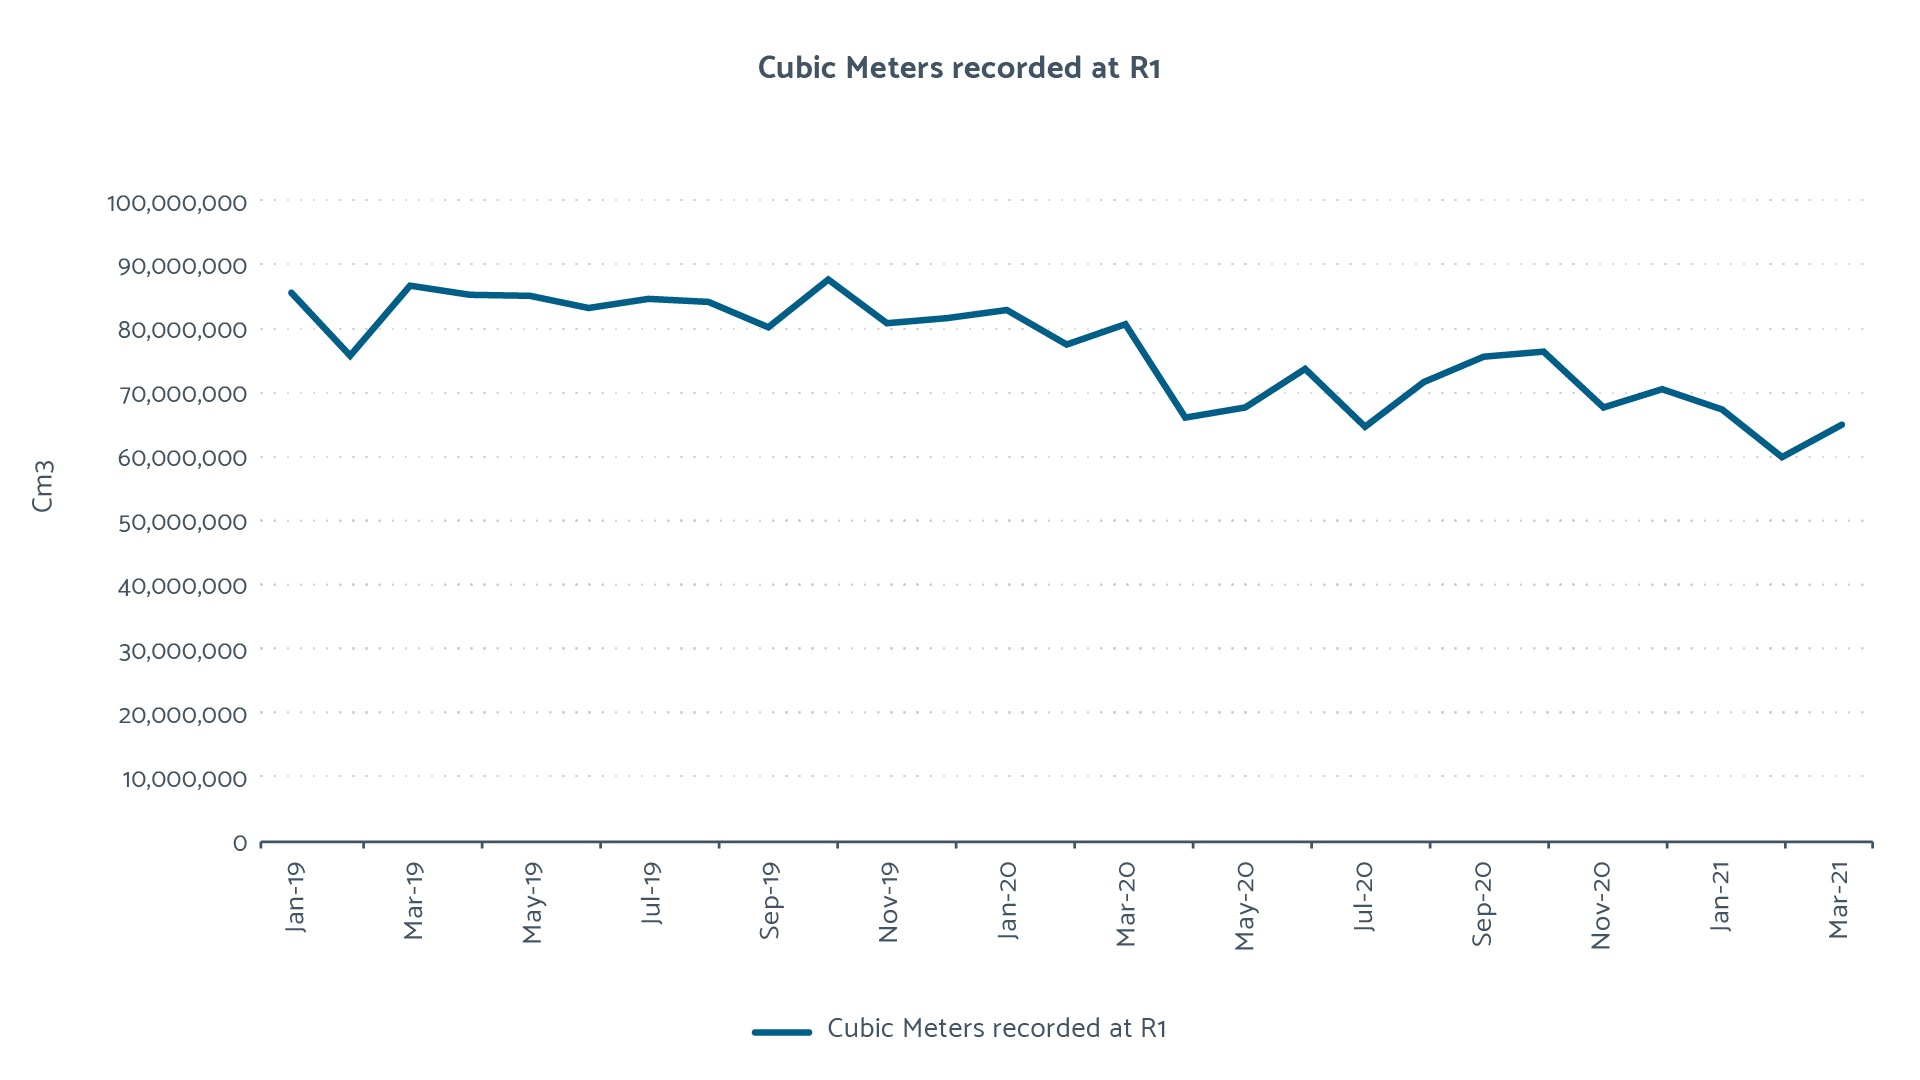
In the market, monthly consumption levels dropped significantly as the first national lockdown was announced, then rose immediately after the lifting of restrictions, before dropping again when further lockdowns were imposed. The Consumption by cubic meters per month graph shows this trend.
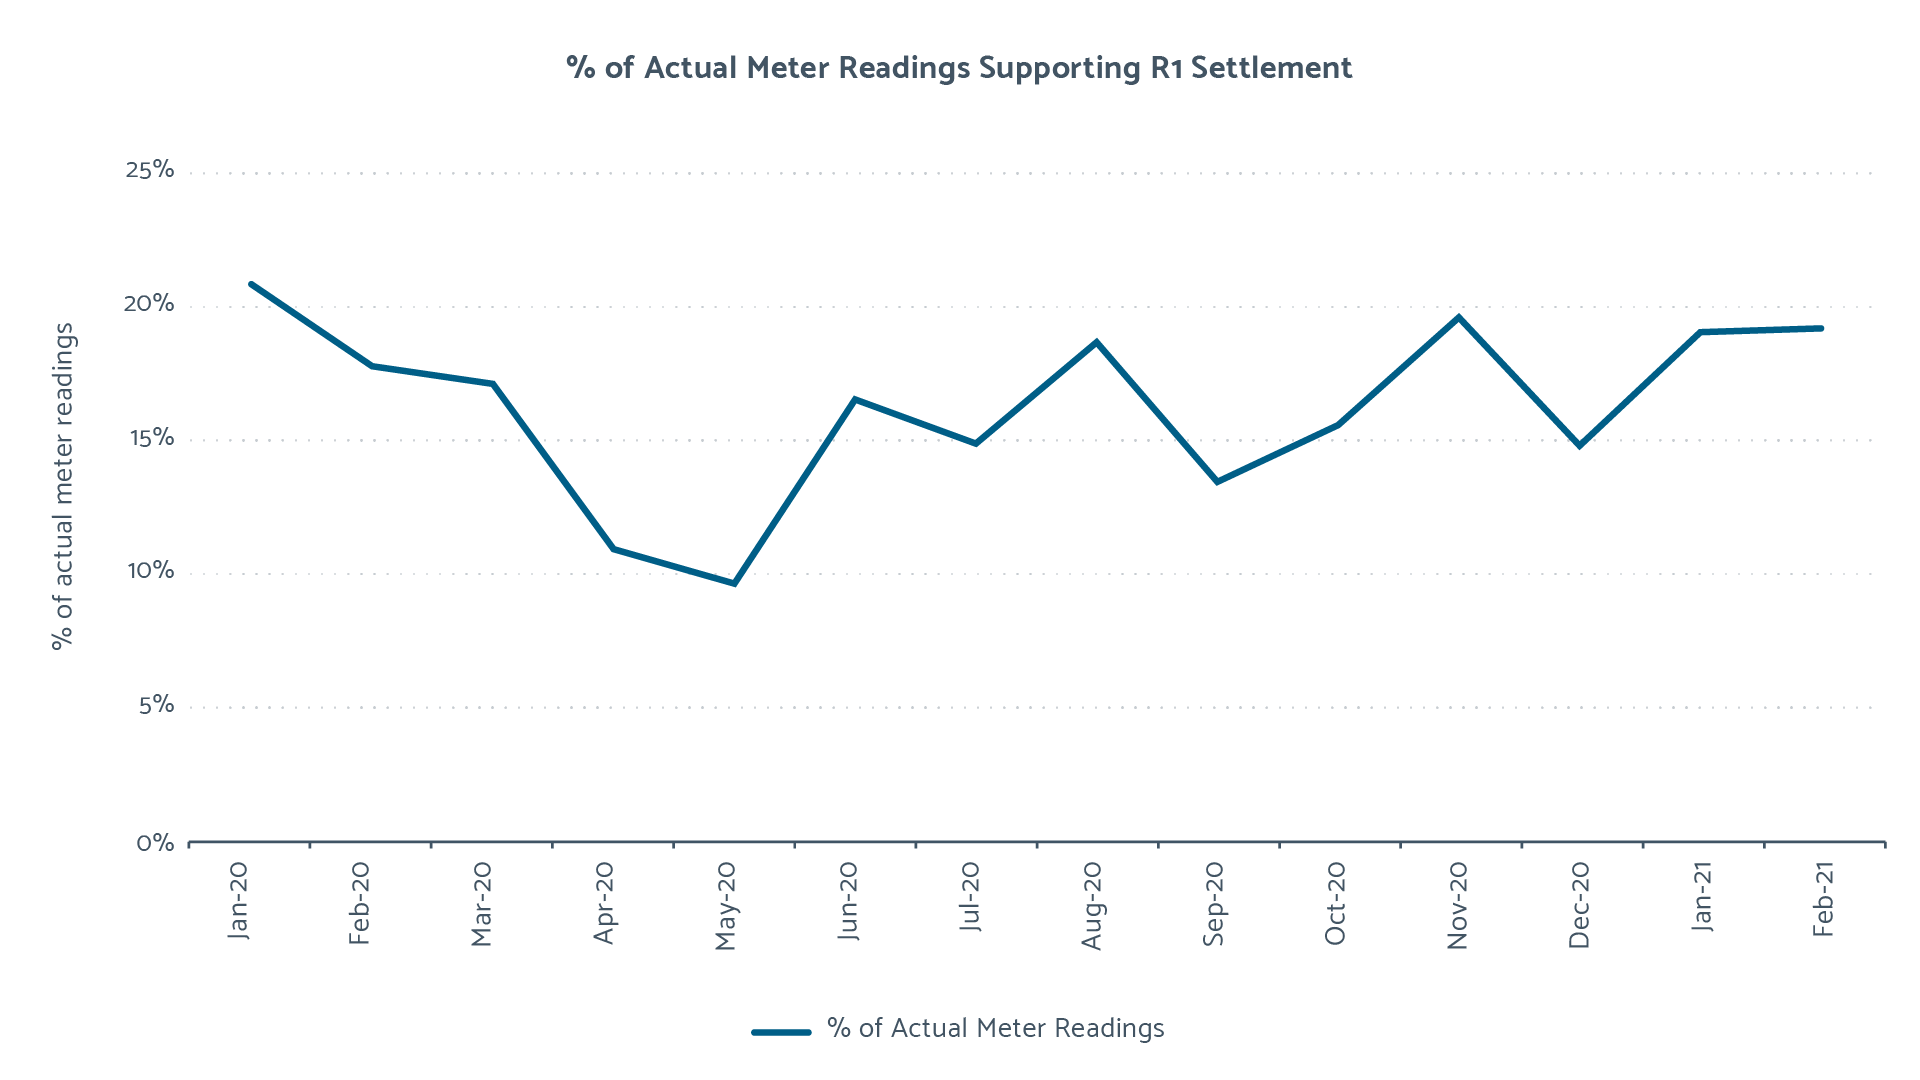
Access restrictions affected customer consumption and the ability for meter reader providers to access some meters. This was highlighted by the reduced reliance on actual reads to support the first reconciliation (R1) of charges, with the most notable impacts being over the periods of lockdown.
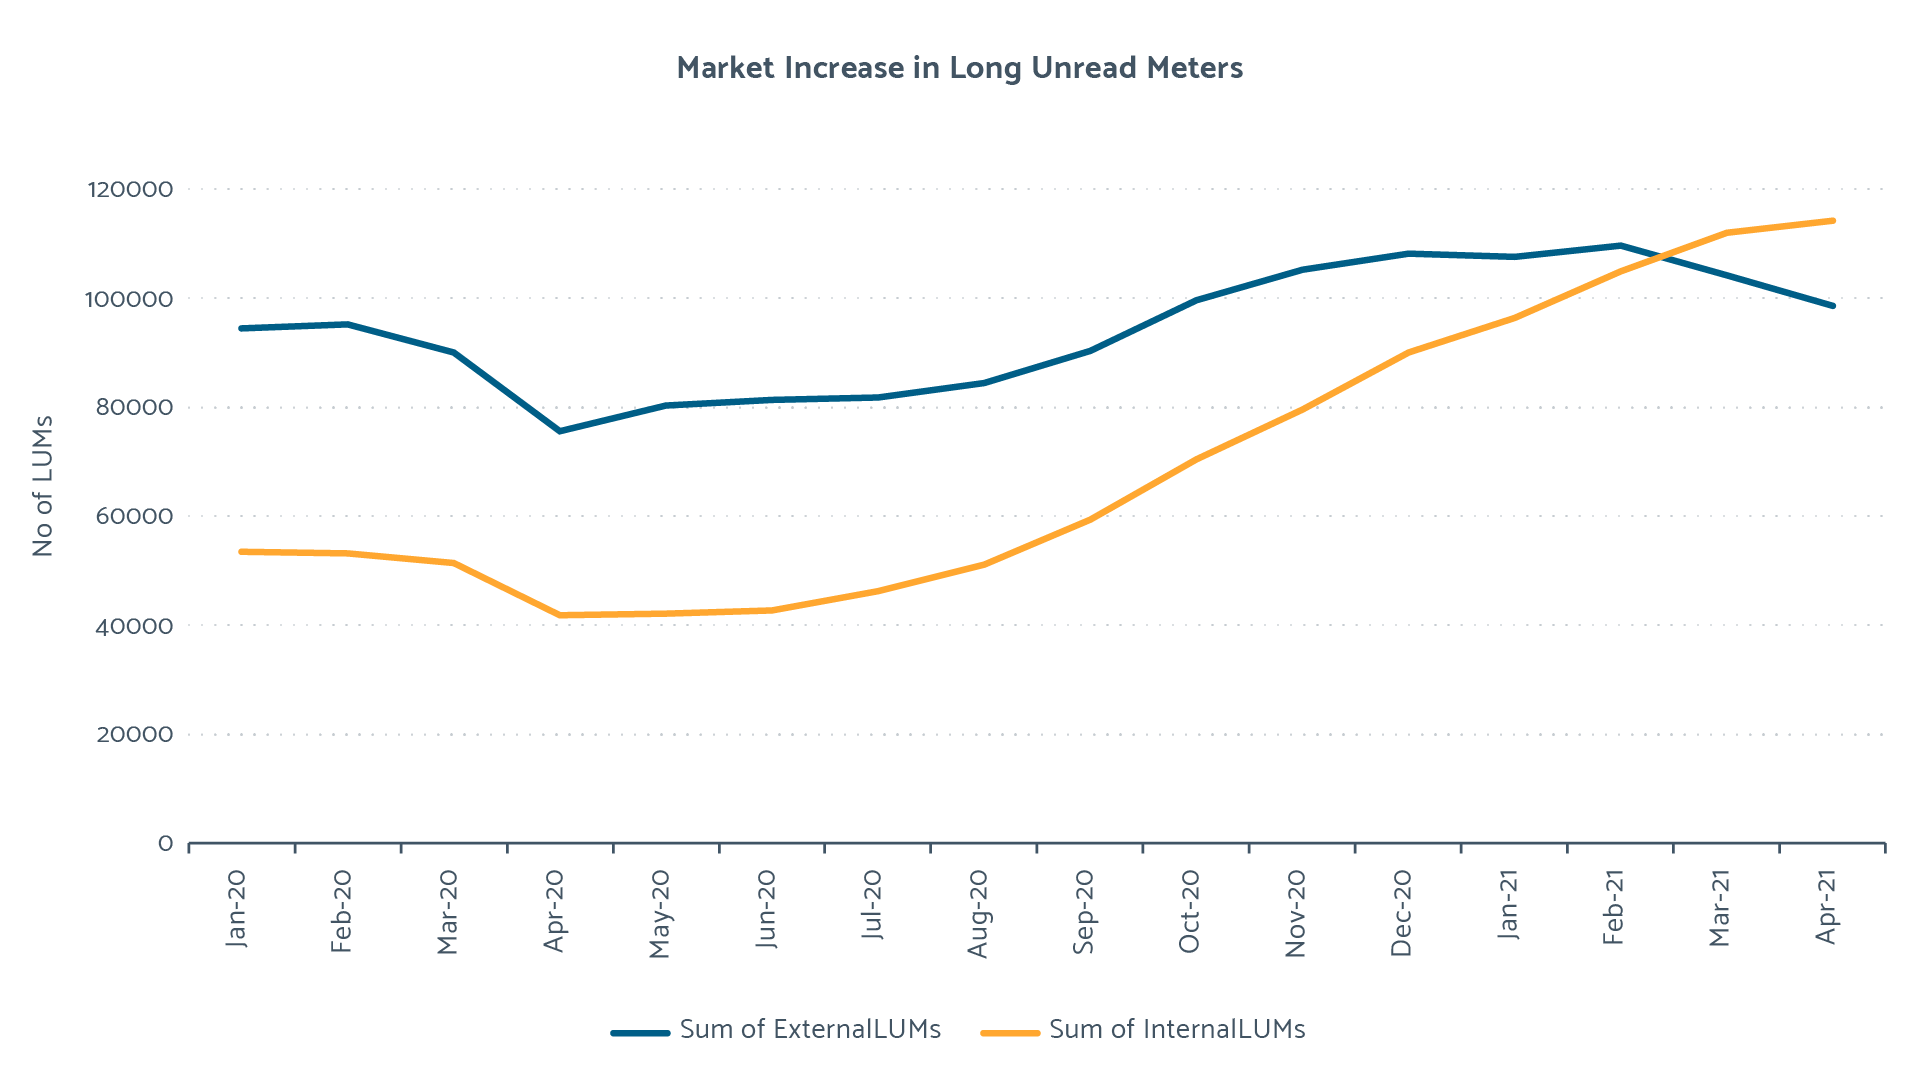
Meter readers found access to internal meters particularly challenging during these periods of lockdown. As a result, we saw an increase in meters which have not been read for 12 months, referred to as Long Unread Meters (LUMs). The speed at which the volume of internal LUMs overtook external LUMs can be seen in the Market Increase in Long Unread Meters table.
With many meter readings relying on estimates, retailers were asked to review Yearly Volume Estimates (YVEs) which had been applied to those customers whose consumption had reduced, either as a result of reduced trade or because they were no longer occupying their premises.
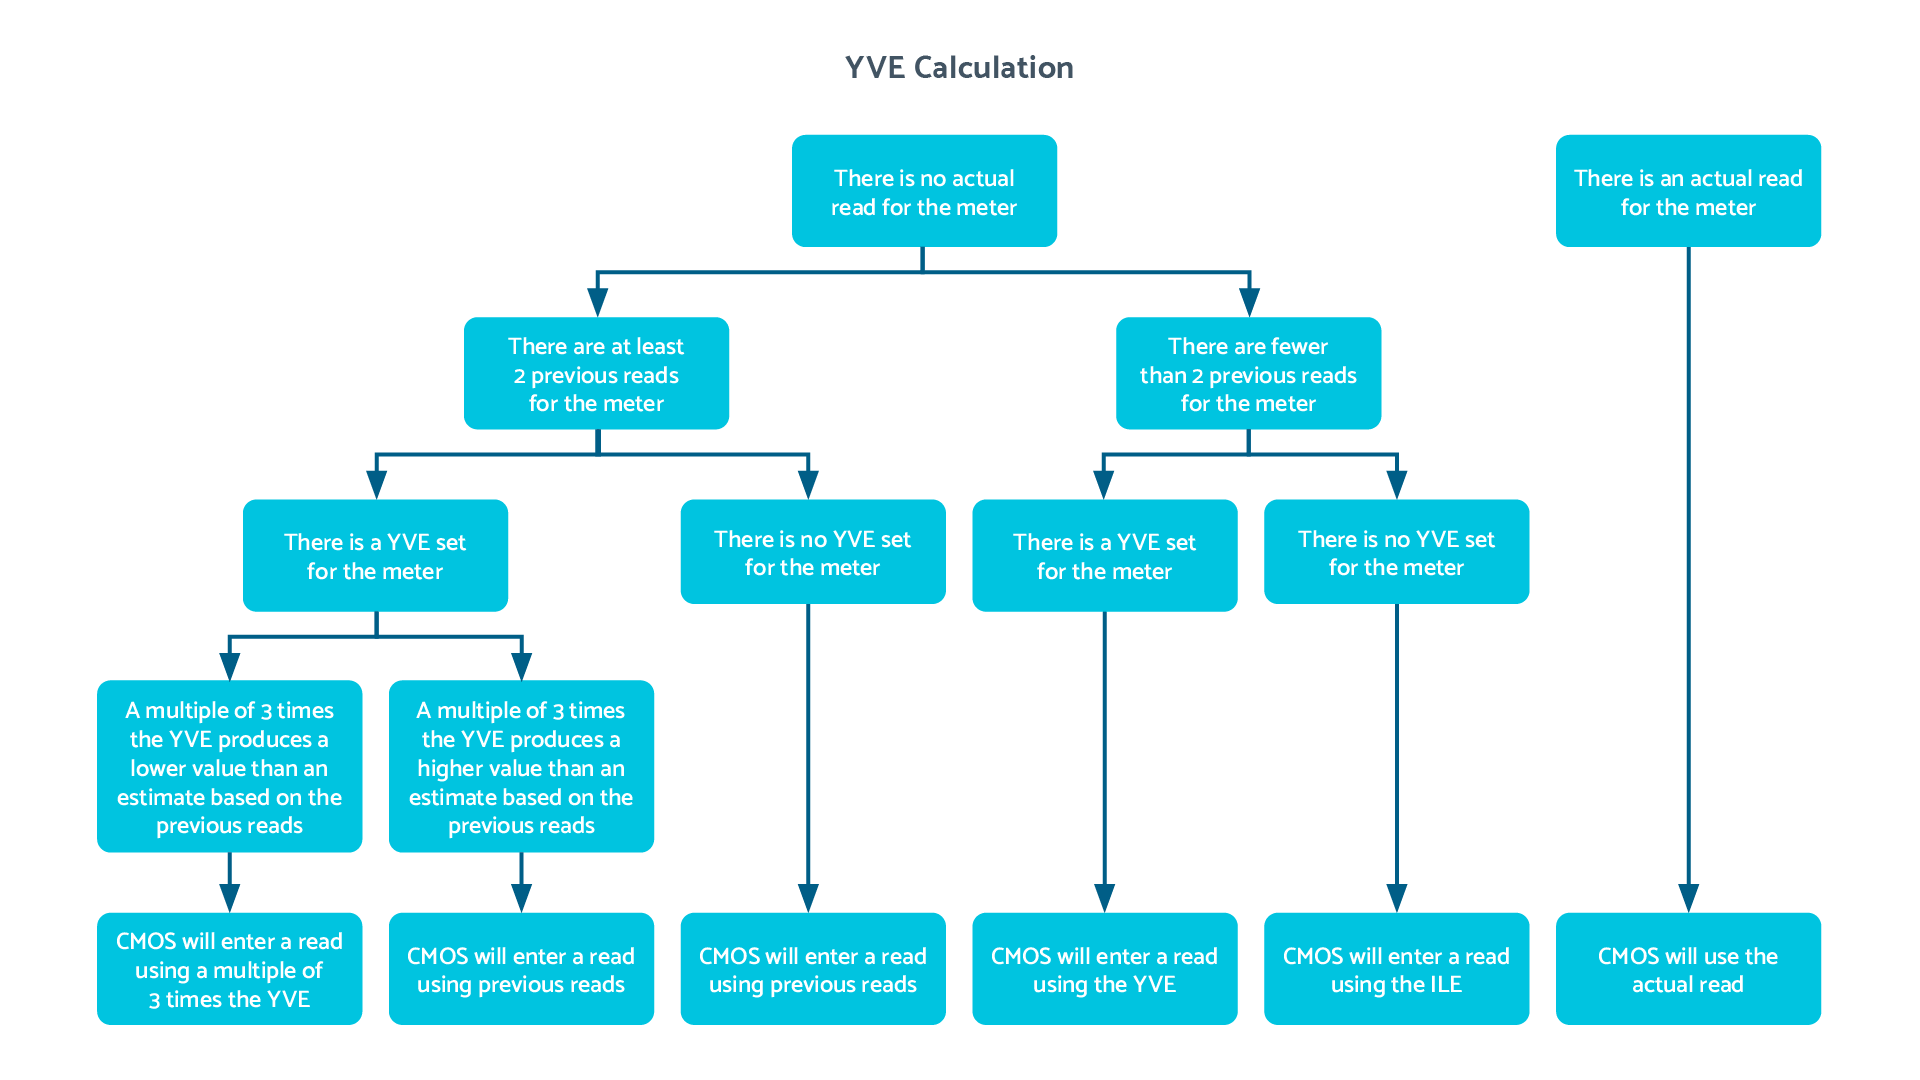
The key factors in the calculation of estimated consumption are previous historic reads, the YVE and the Industry Level Estimate (ILE) which acts as a backstop by calculating a read based on the average consumption of water depending on the size of the meter. It is used where there are no historic reads or YVEs for a meter. The estimation method used is explained in more detail in the YVE Decision Flow Diagram.
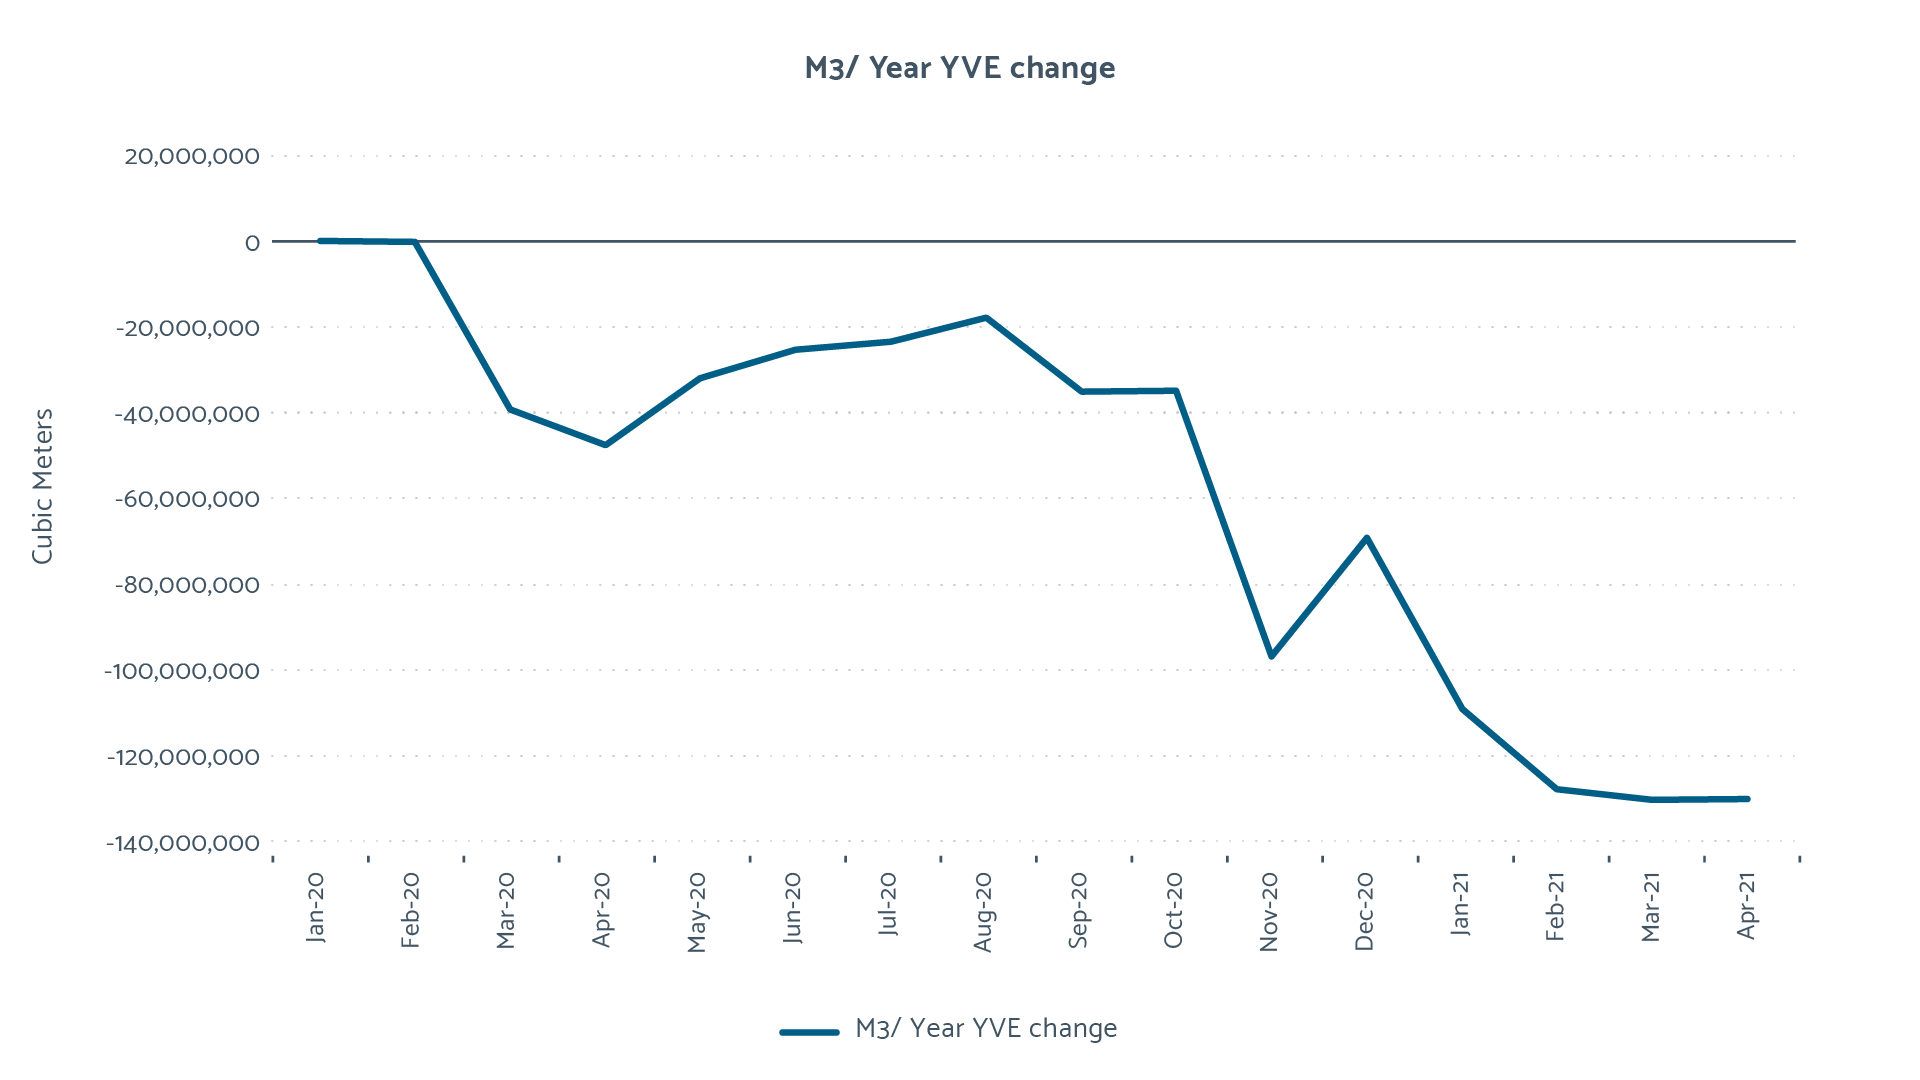
The potential cumulative effect on estimating consumption by trading parties lowering (and sometimes raising) the YVEs, as taken from a baseline of January 2020, is shown in the Cubic Meter / Year Cumulative YVE Change graph.
At the end of 2020/21 the reduction in YVEs suggests that the market could expect, over a 12-month period, to see a reduction in consumption of just over 130,000,000 cubic meters of water. This would equate to a reduction of 13 per cent compared to the annual consumption for 2019/20 (985,500,000 cubic meters).
The Cubic Meter / Year Cumulative YVE Change graph shows a dip in the use of YVEs between April-June 2020. This can be attributed to retailers using the temporary vacancy provisions available to them during this time and explains why the YVE effect was less in the first lockdown, despite that lockdown being the most extensive.
YVE impacts will only materialise if settlement relies on estimated reads. With access restrictions lifting at the end of 2020/21, we expect to see a rise in the overall percentage of actual reads for settlement as well as trading parties recalculating those YVEs which were dropped last year.