Market Settlement
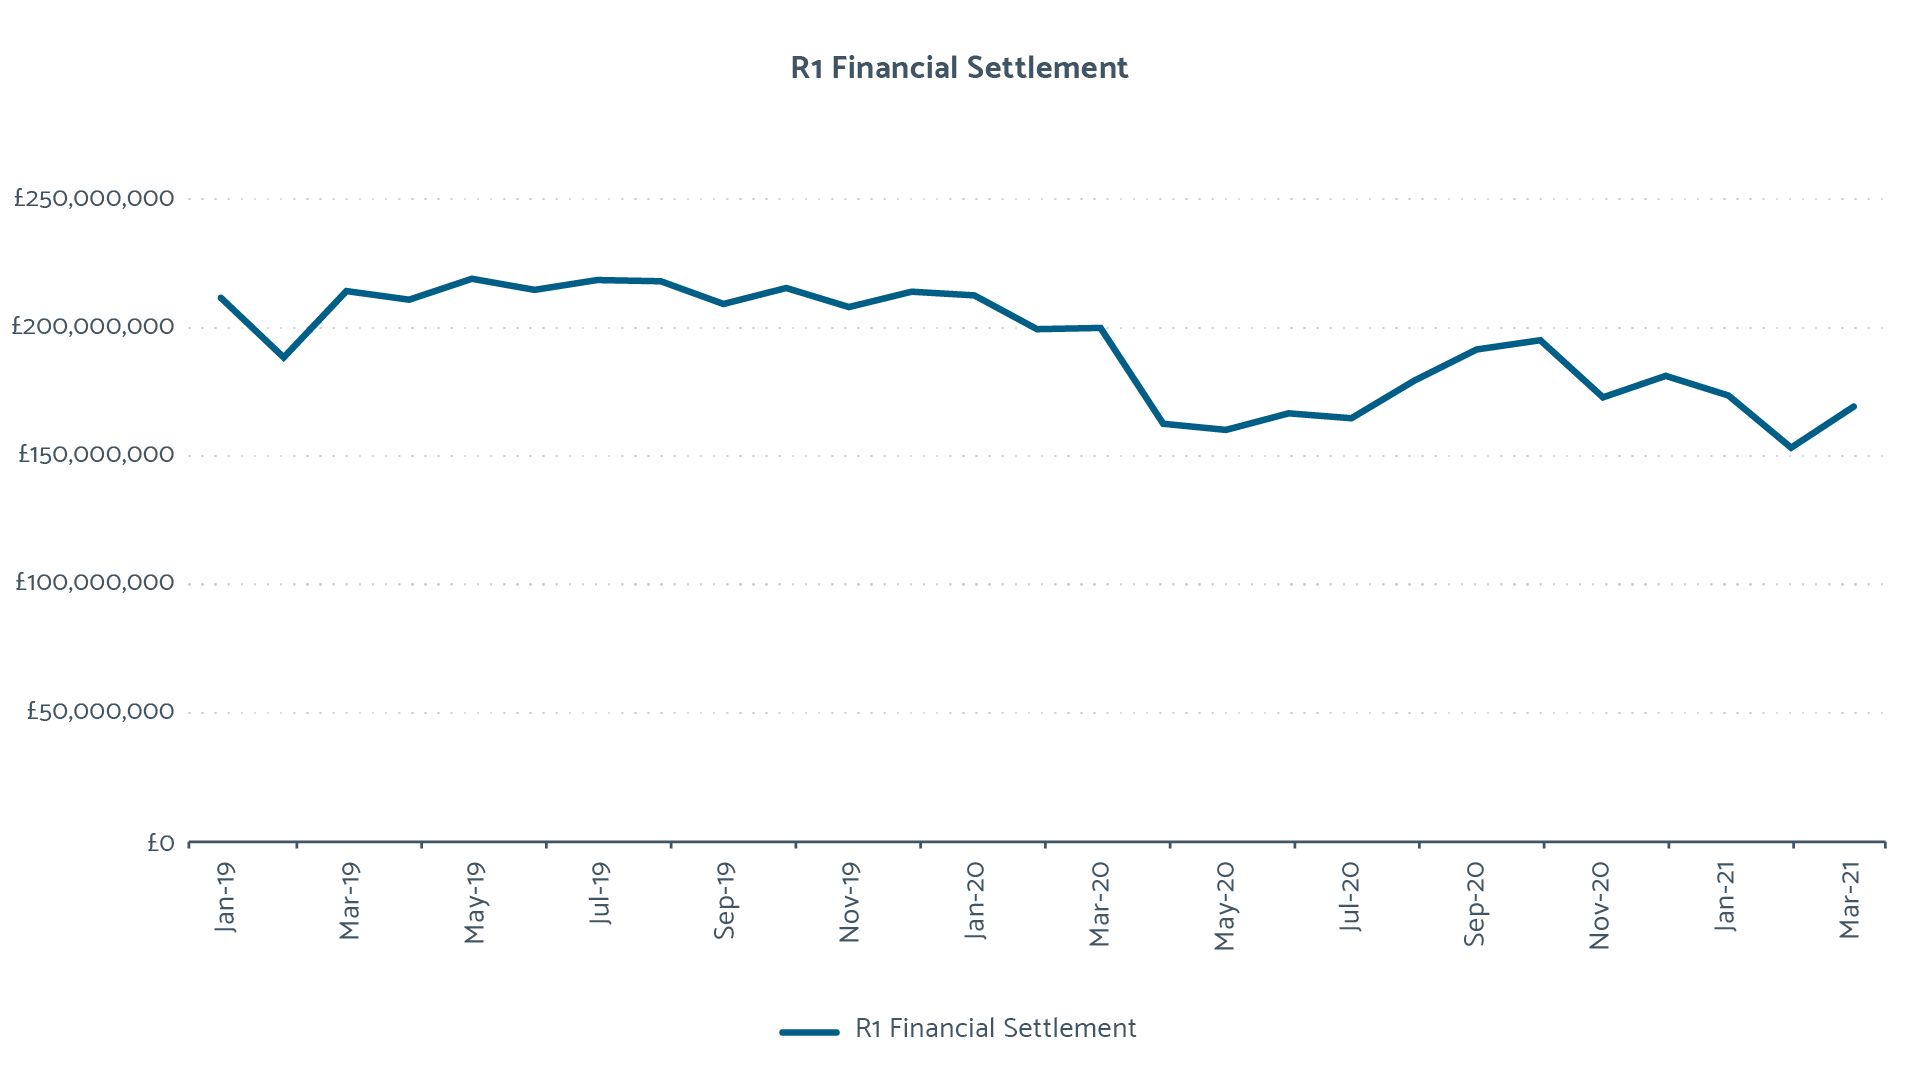
The total charges settled at R1 has been dropping in line with consumption levels, as can be seen in the R1 Financial Settlement Graph. The graph includes settlement from January 2019 to allow 2020/21 comparison with pre-pandemic settlement.
The assessment of the level of parity between R1 settlement and the second reconciliation (R2) (captured two months after R1) and third reconciliation (R3) (captured eight months after R1) has received greater focus because of the pandemic.
Meter readings and submissions continued to be tracked by reporting against the Market Performance Standards, however, the ability to use estimates accurately, including the use of YVEs, has become a key indicator to the accuracy of settlement, especially when meters are difficult to access.
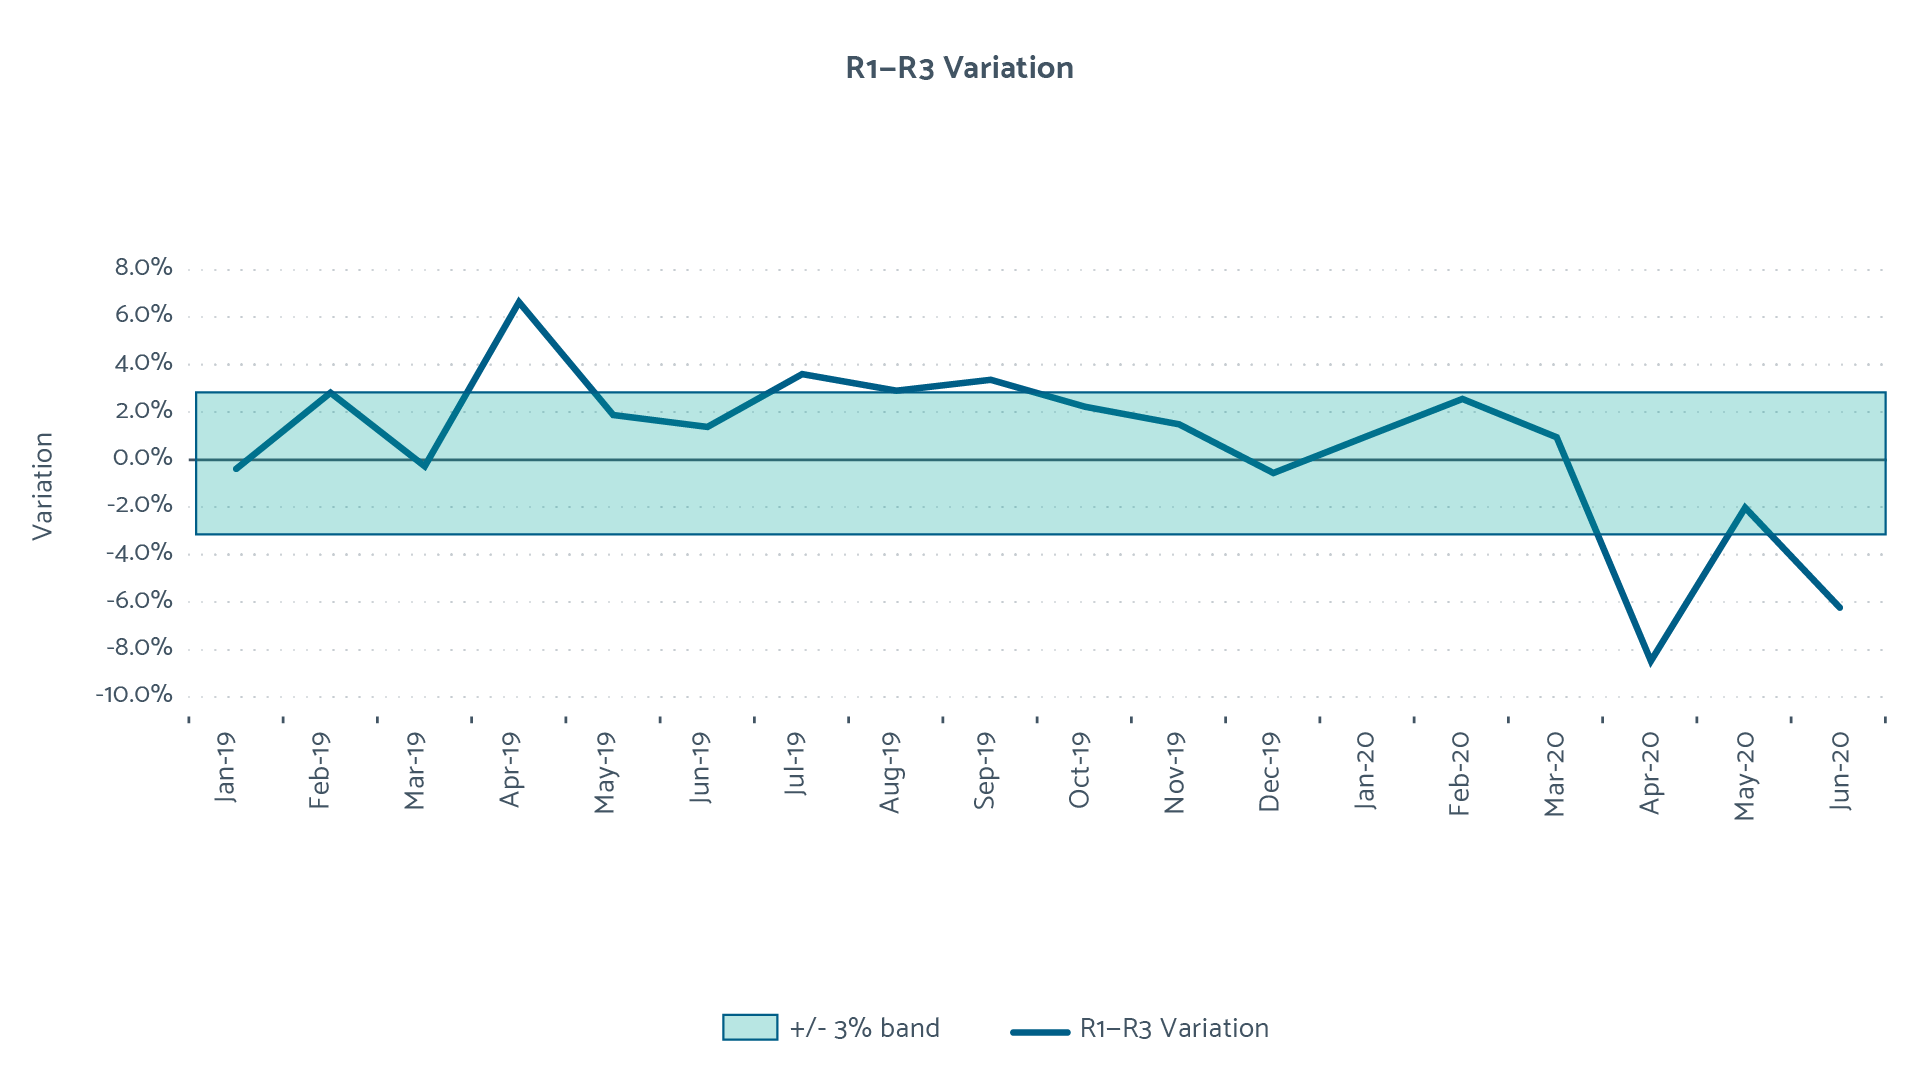
We have not reported on the overall performance of the market in this area in previous years, but it could be represented as R3 typically being within plus or minus three per cent of R1. The R1 - R3 Variation Chart shows the point at which keeping the difference between R1 and R3 within that three per cent range became challenging for the market last year.
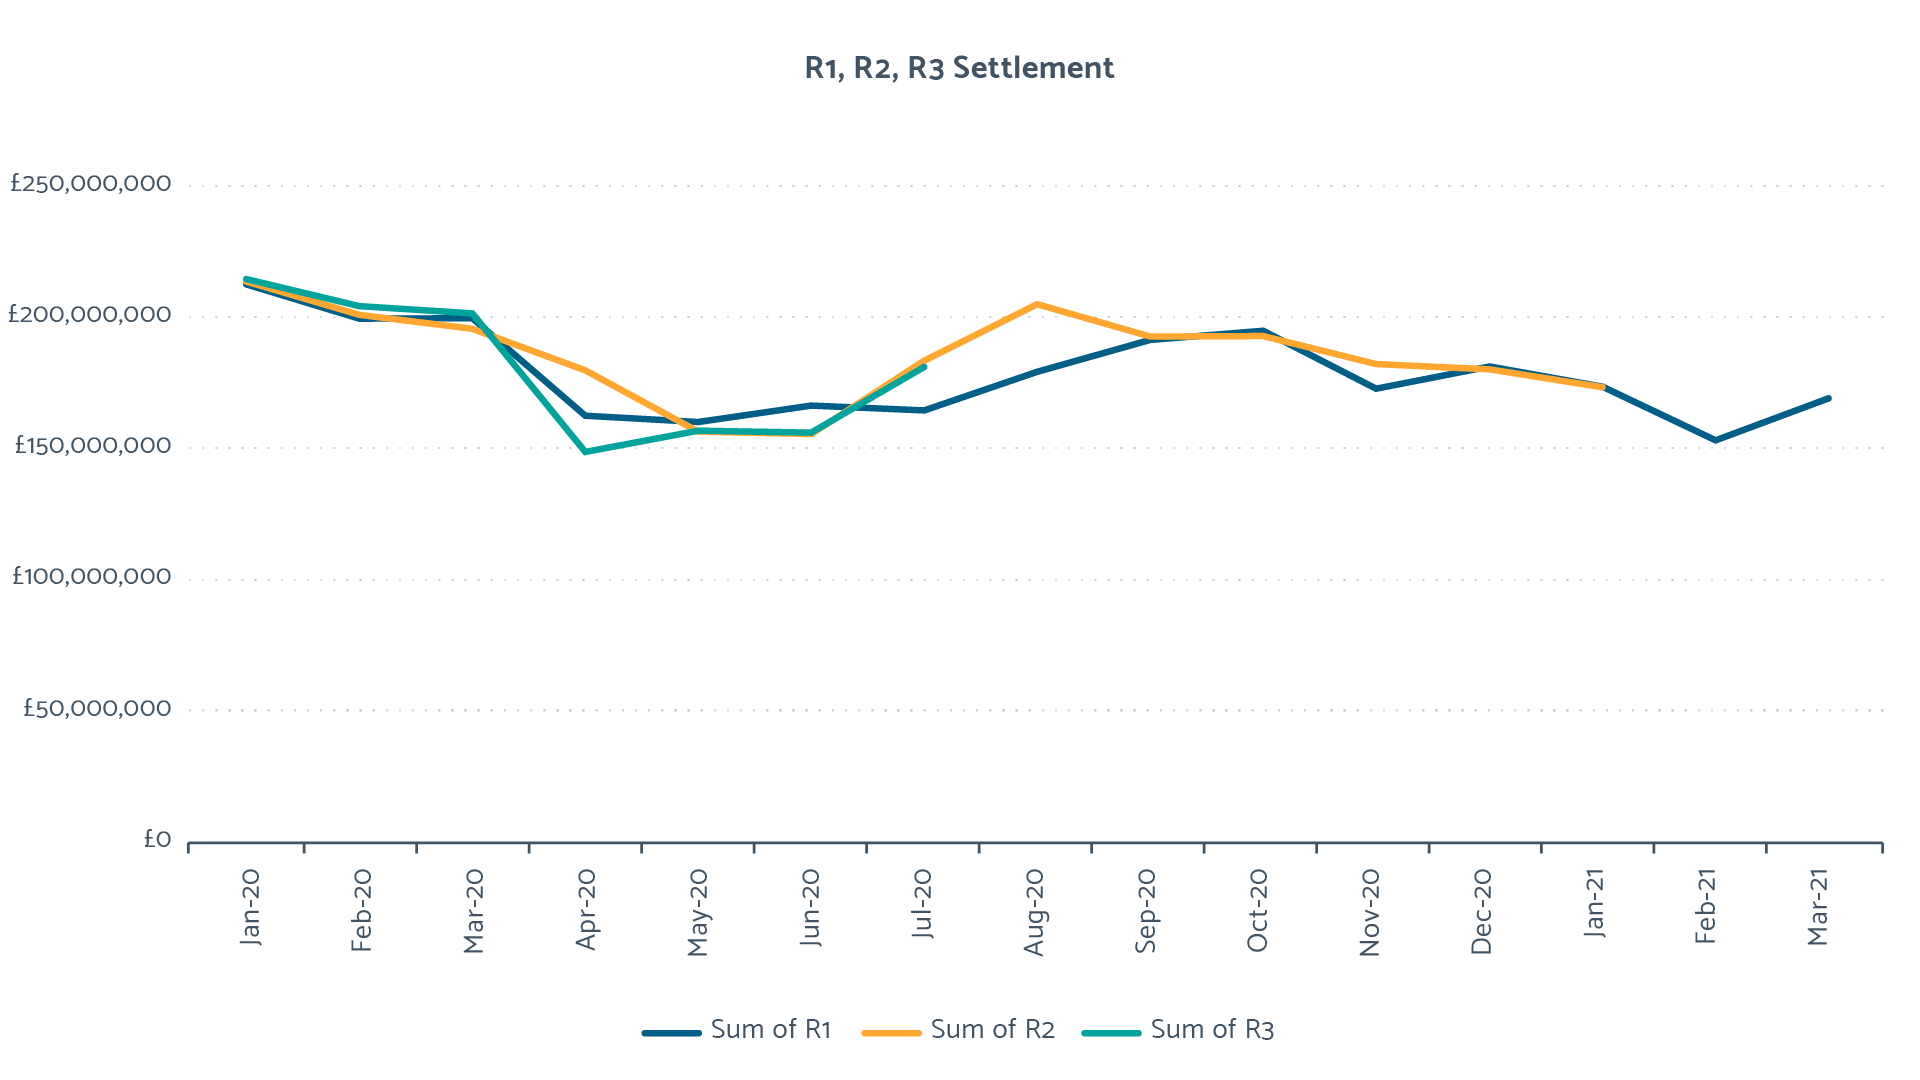
This has implications both for the accuracy of settlement between retailers and wholesalers and for future customer billing. The settlement impact, noting the disparity between first, second and third reconciliation settlements during lockdown, is represented in the R1, R2 and R3 Settlement graph. It is encouraging to see second reconciliation settlement returning to alignment with the first settlement as the year ends. Visibility of R1-RF differential is currently limited to Q3 of 2019/20. As this becomes available, we will monitor the R1-RF differential as settlement progresses through RF for COVID-19-affected periods.
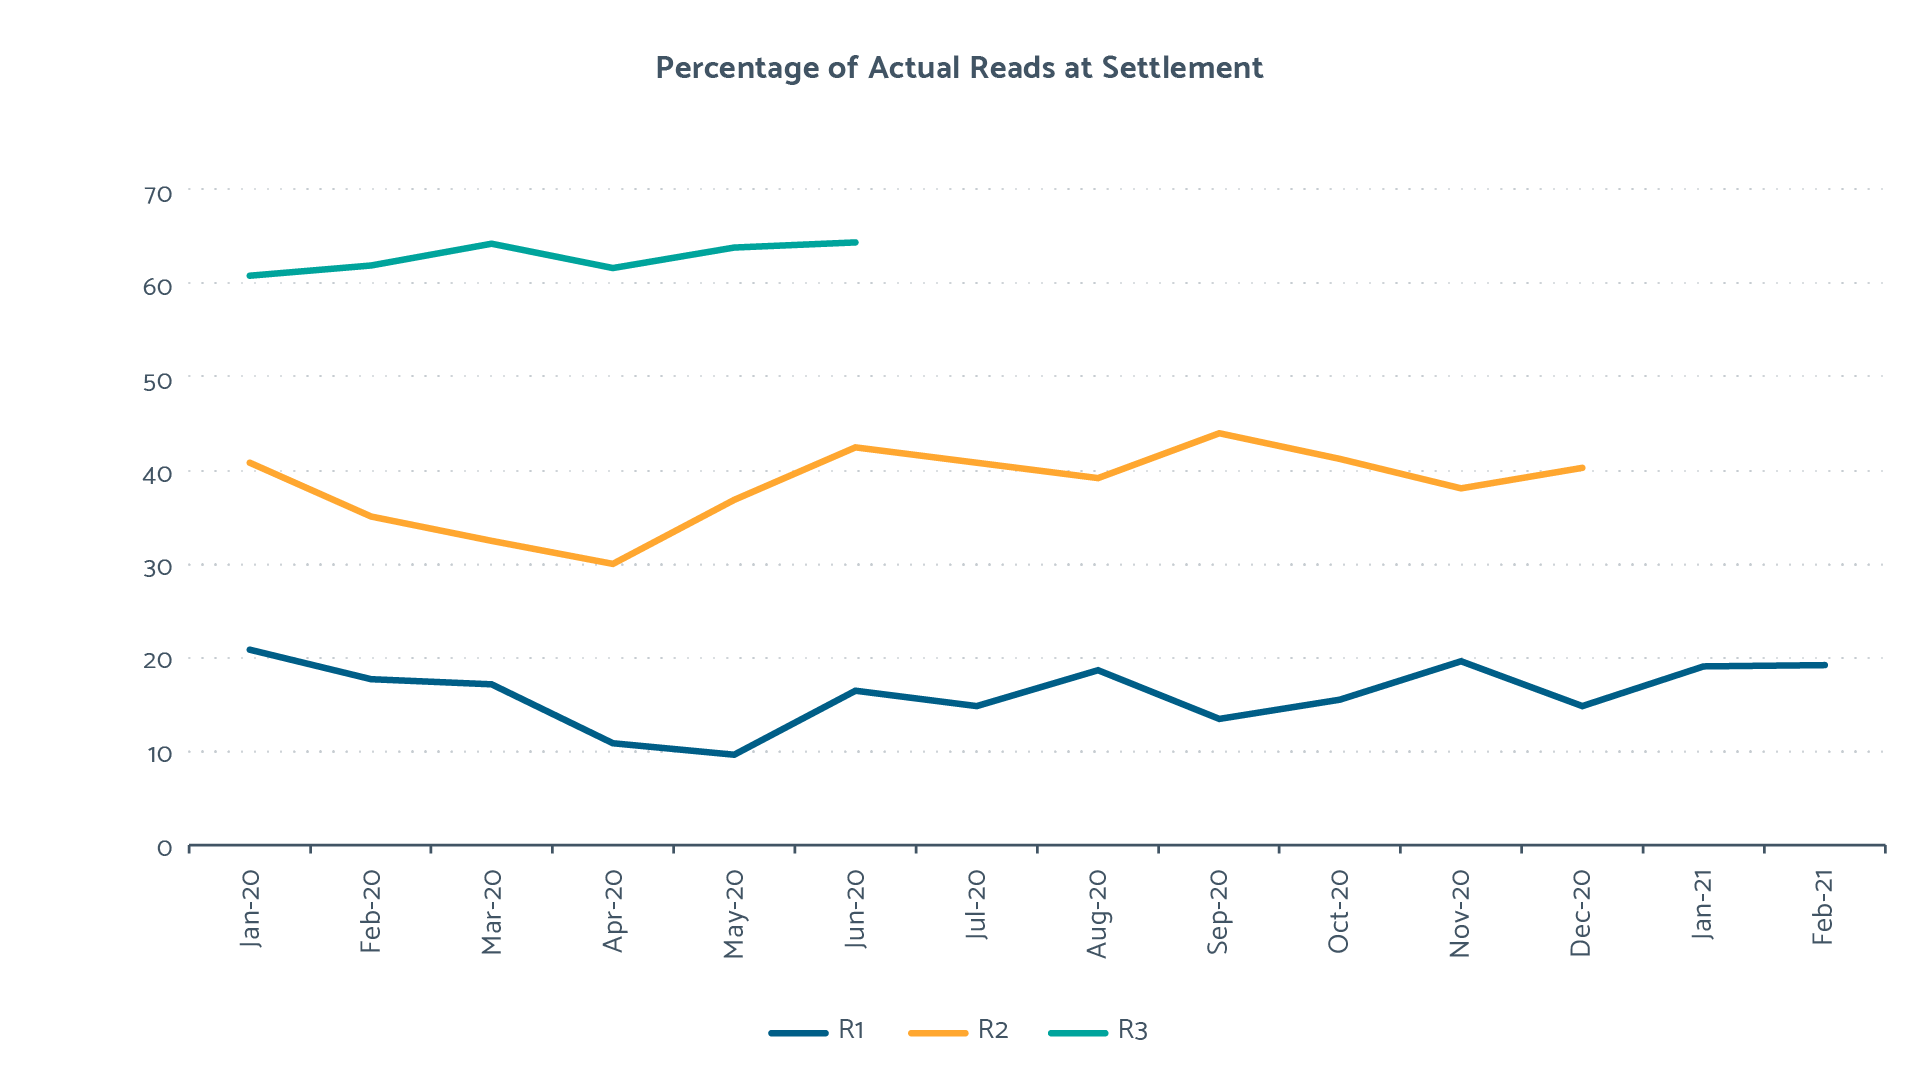
The subsequent impact on customers will depend on when the customer bill is calculated and invoiced by the retailer. We will continue to monitor the levels of actual reads used in the settlement runs as well as the variations between initial settlement and third settlement over the course of next year. This will also support CCW and Ofwat in ensuring customer expectations around their bills, and the accuracy of these bills, are met. This will include the monitoring of individual trading parties against their levels of actual reads at R2, R3 and RF as well as R1. The current market averages for these values can be seen in the Percentage of Actual Reads at Settlement graph.